
Epidemiology Web Portal

Embracing science and technology
As a Product Designer, I crafted an intuitive interface, integrated data visualization tools, and devised a holistic user journey for the MIDAS Network, a leading consortium dedicated to modeling infectious diseases.
Problem Statement
There was a need for a unified platform that amalgamates diverse datasets on COVID-19 and presents them in an easily digestible format. The portal had to cater to the unique needs of computer scientists, biostatisticians, and biomedical informatics professionals during unprecedented times.
Team Composition
1 Organizational Leader
1 Product Designer
2+ Software Engineers
Team of Stakeholders
MY IMPACT
Brought UI/UX to epidemiology group
Redesigned public-facing website
Created web portals for data visualization
Collated datasets in a unified interface
An Undertaking in Epidemiology
The MIDAS Network, a global consortium spun out of Pitt Public Health, renowned for modeling infectious diseases, was pivotal during the COVID-19 pandemic. Public Health organizations were engaged in creating and synthesizing datasets to understand the transmission and trends of the virus from the onset; in a matter of months, the world was at the mercy of COVID, and entire countries were enforcing lockdowns. The network of computer scientists, biostatisticians and biomedical informatics experts at MIDAS recognized the significance of centralizing epidemiological data to guide research and public health decisions.
Research and Innovation
In many projects I need to garner an understanding of complex domains in a short amount of time to 'ramp up' and support the process improvement and advocacy of design; I do this by working with cross-functional teams and diving into documentation.
Drawing upon the needs of MIDAS' extensive community of 400+ stakeholders, I worked with a dedicated group of subject matter experts to design and deliver web portals that promoted accessibility and visibility of disparate datasets related to their spread and associated trends, to streamline comprehension. In addition to the data portal, I guided the team’s introduction of a public-facing website that described their mission, objective, and members. This work was especially critical during the pandemic when all eyes were on the organizations that had a grasp on the subject matter of infectious disease modeling and prevention.


Understanding the Subject Matter
Epidemiology is a field pivotal in our collective understanding of infectious diseases and their impact on global health. The dynamic nature of infectious disease modeling, especially during the unprecedented times of the COVID-19 pandemic, necessitated a deep immersion into the subtleties of disease spread, vaccine efficacy, and the profound implications of diverse interventions. I found myself garnering a deeper understanding of the nuances of the organization and how they leveraged datasets to conclude the spread of disease.
I engaged with a small, multidisciplinary team, to craft design-based solutions for their needs, and incorporate feedback in a closed-loop environment. By establishing a symbiotic relationship between the team and myself, my design vision intertwined with the team’s scientific acumen and the needs of the end-users and researchers, empowering me to create a user-centric design of the data portal. The pages, components, and user experiences resonated with the core objectives of the project and served as a bridge, uniting epidemiology with the intricate art of user experience, ensuring that data was accessible and actionable.
Section of the redesigned website that focused on providing a better holistic view of the news, events, and members at MIDAS, above the fold. When designing for data scientists and statisticians, they like seeing more content in less space, and don’t like the idea of having to poke around for meaning; I designed the above-the-fold content to pack in more context and allow new users to grasp what MIDAS was about in a short period.
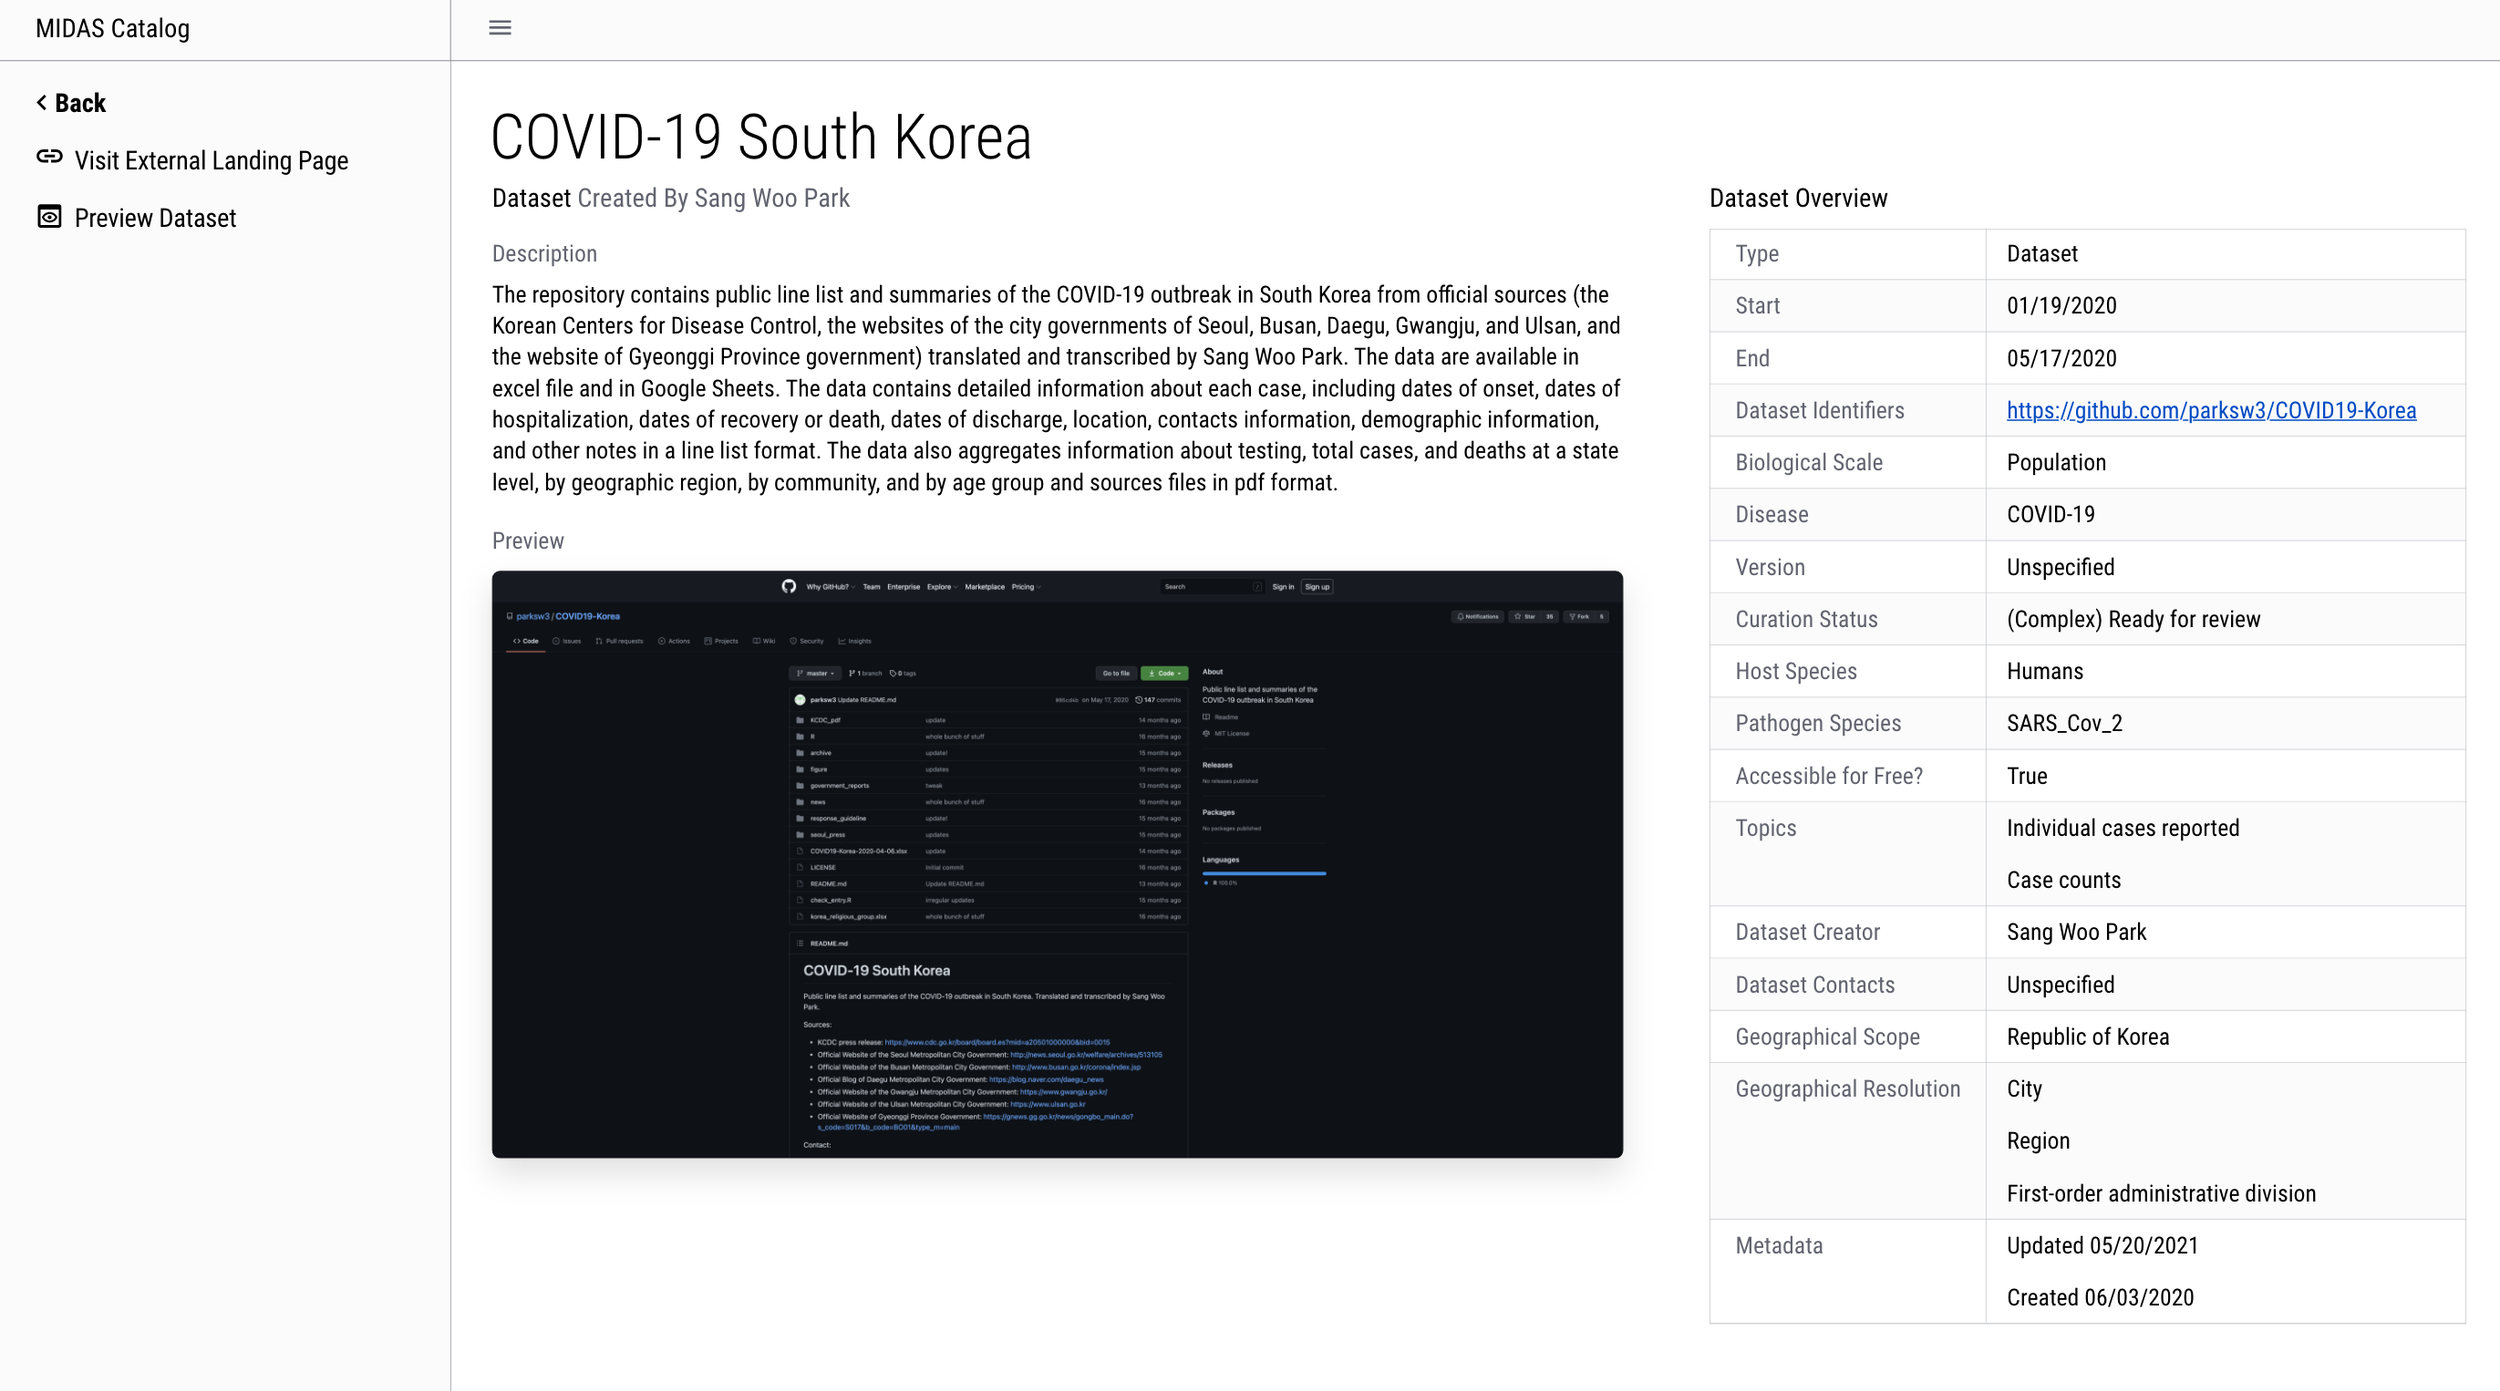
Data Visualization and Interactions
A well-visualized data point can tell a story, offer insights, and drive decisions. Understanding this, the portals were crafted to serve as a narrative of the pandemic's global progression. With care, I incorporated graphs, histograms, maps, and other visual tools to distill multifaceted data into understandable stories. The creation of a data dictionary accentuated this, offering users unparalleled ease in sifting through, comprehending, and acting upon indicators.
Process Improvement
Embracing an iterative design methodology, the process involved empathizing with users, defining data presentation needs, ideating visualization strategies, prototyping interfaces, and testing solutions with stakeholders, ensuring alignment with user needs and organizational goals.
The fluidity of the pandemic necessitated a dynamic response. As new datasets poured in from diverse sources, the challenge was found in effective presentation. Integrating the aesthetic coherence of the website's design system, I sculpted tables and interfaces that housed this influx in a manner that prioritized user empathy. By channeling the perspective of a scientist, the design ensured that data navigation and exploration felt less like a task and more like an intuitive journey, empowering end users at every step.
The Impact of the Project
The project's culmination marked a significant milestone in global collaborative efforts against COVID-19. The revamped website emerged as a hub of centralized knowledge and insights. Through design considerations, the portals seamlessly brought together diverse data streams, offering researchers and experts a unified platform to harness the power of shared knowledge. In shaping this interface, the design went beyond aesthetics, fostering a community-driven discovery process and solidifying MIDAS' commitment to combating infectious diseases through collaboration and shared expertise.
Outcomes and Results
The website and research portals became a cornerstone for global COVID-19 data analysis, driving enhanced data-sharing, fostering community-driven discovery processes, and catalyzing research innovations for the larger scientific community.